Data source qualification
Data source rule
Menu: Library/Data
You can measure the quality level of any source by assigning rules to the columns and then measure the source quality.
If you take the rule described in the previous sections, it can be assigned to the zip code column.
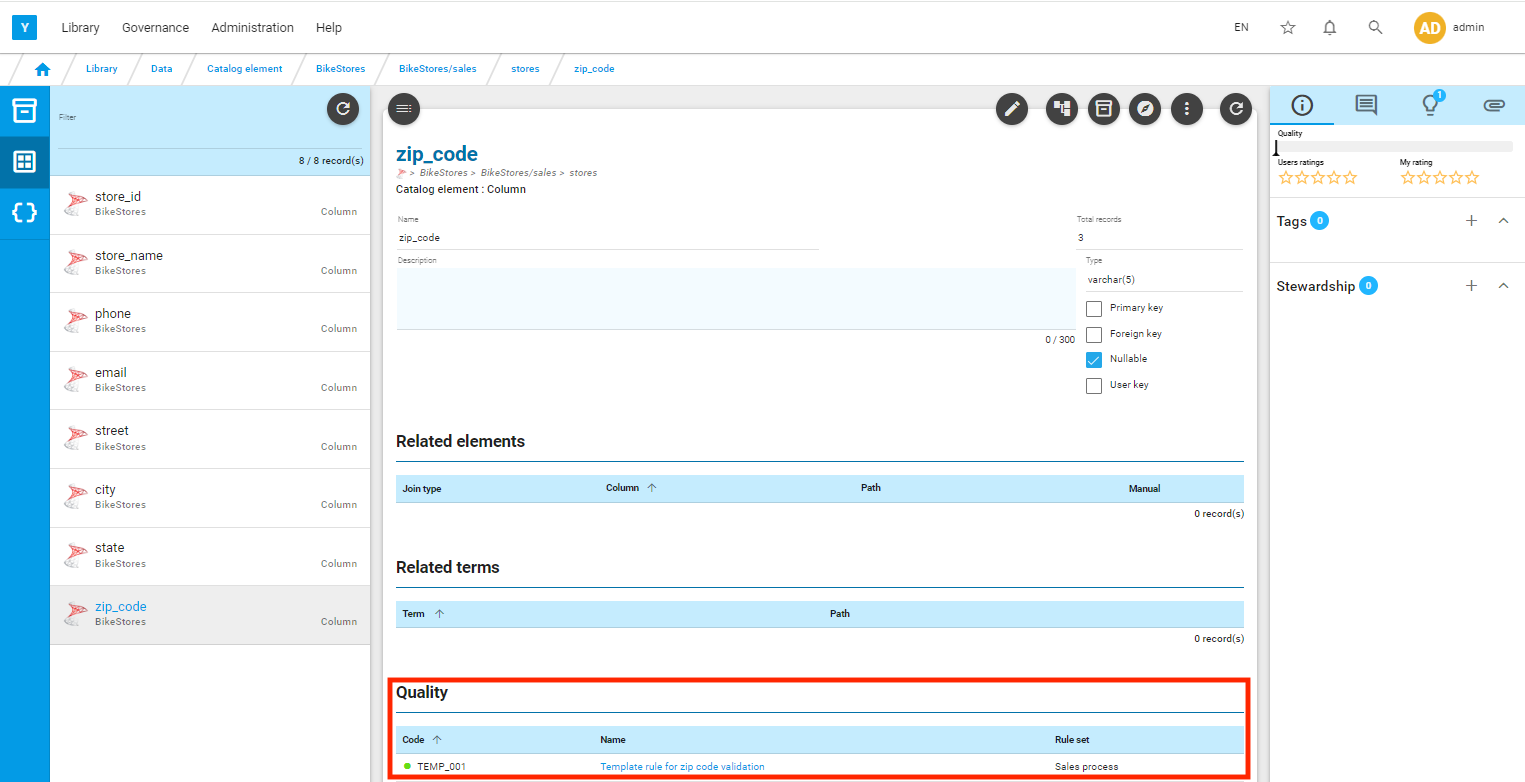
Go to the BikeStores.sales.customers.zip code column page in the catalog view and click on ![]() to edit the asset.
to edit the asset.
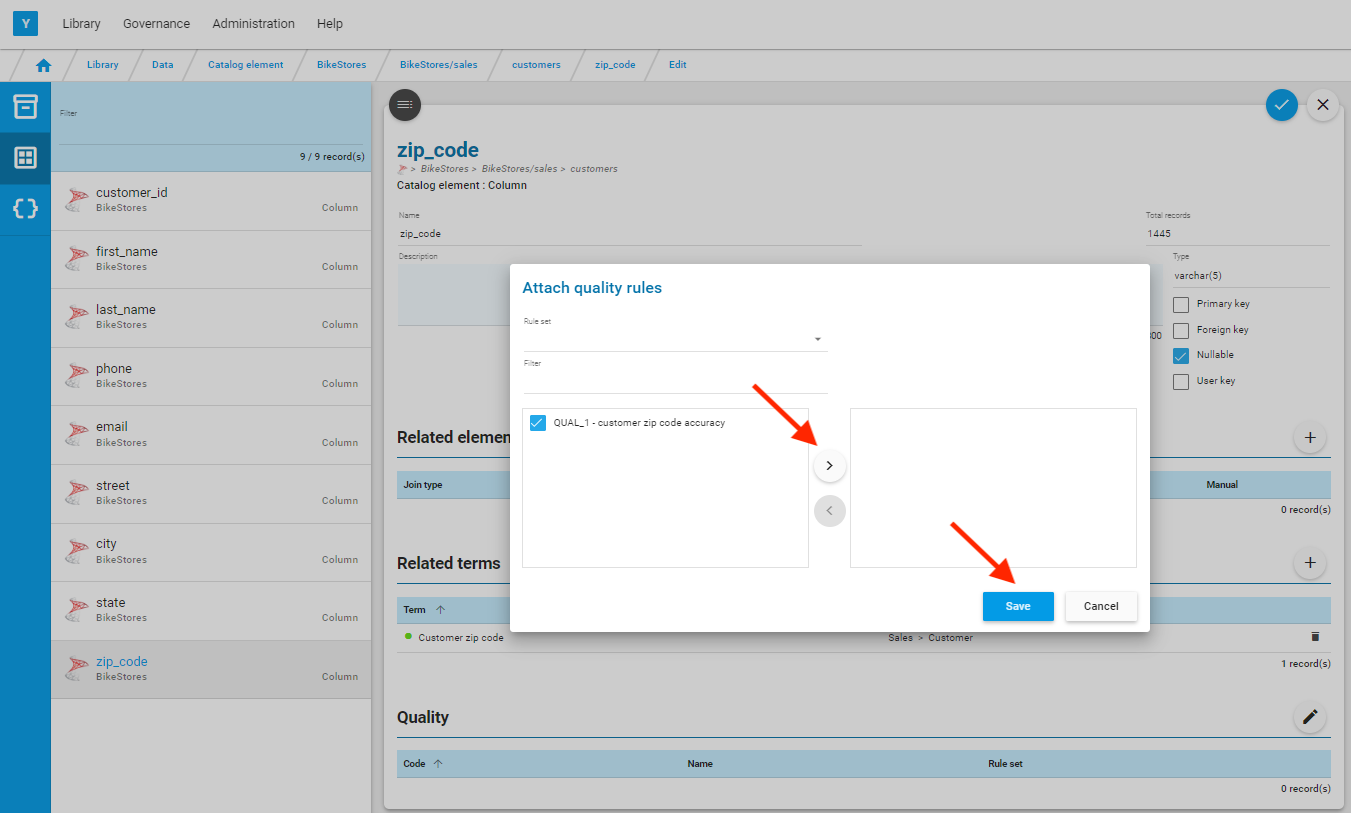
Then click on ![]() in the Quality section. Select a rule in the popup window, move it to the right and save.
in the Quality section. Select a rule in the popup window, move it to the right and save.
Save the asset via ![]() .
.

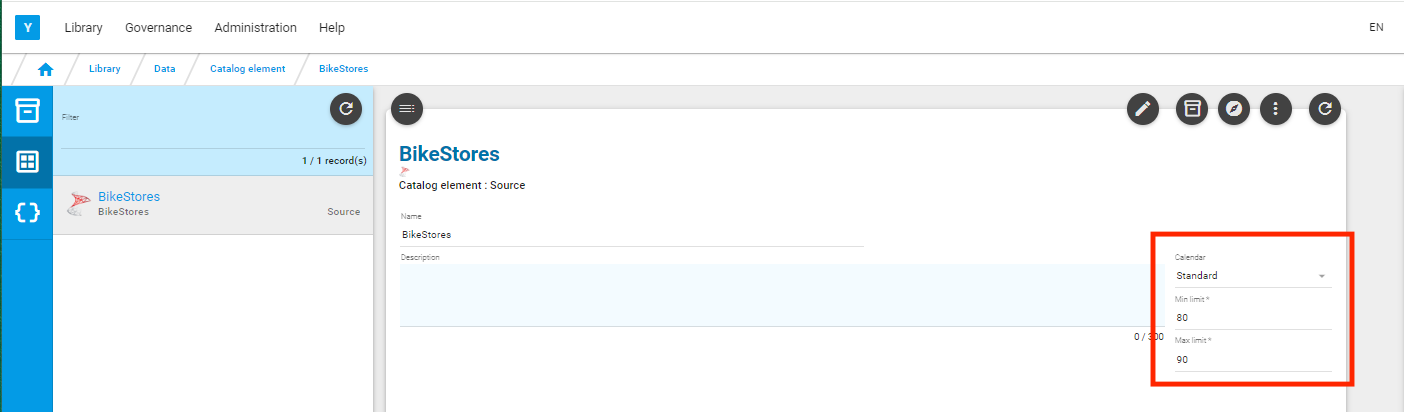
Make sure that a calendar has been assigned to the source level page in the catalog.
You can now measure the quality of the data source.
Data source measurement
Menu: Administration/Measurement/Execution
Select the earliest future calendar date displayed on the left, select the data source, and click on ![]() .
.
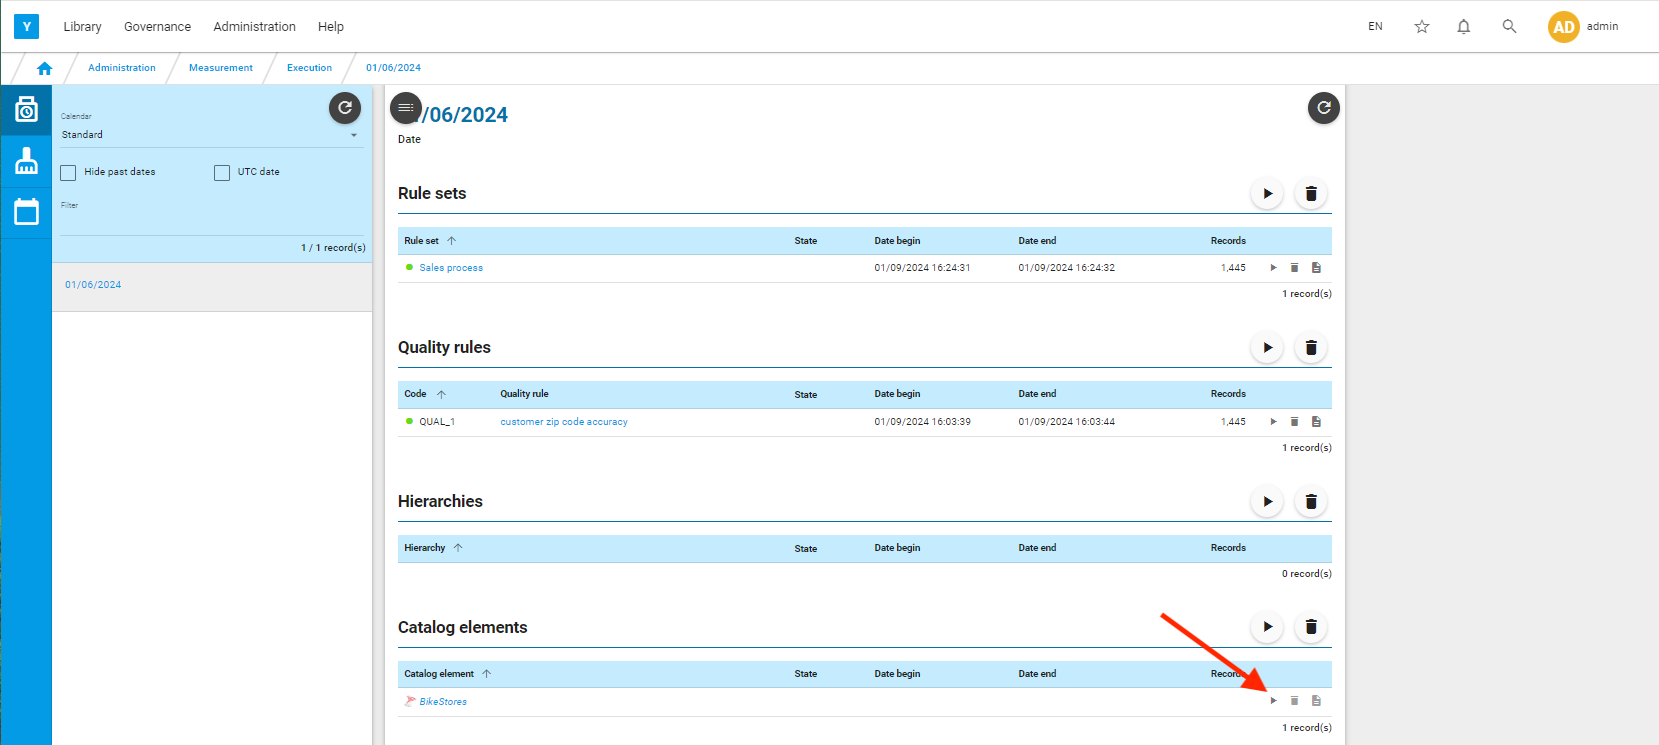
Click on ![]() to refresh the screen.
to refresh the screen.
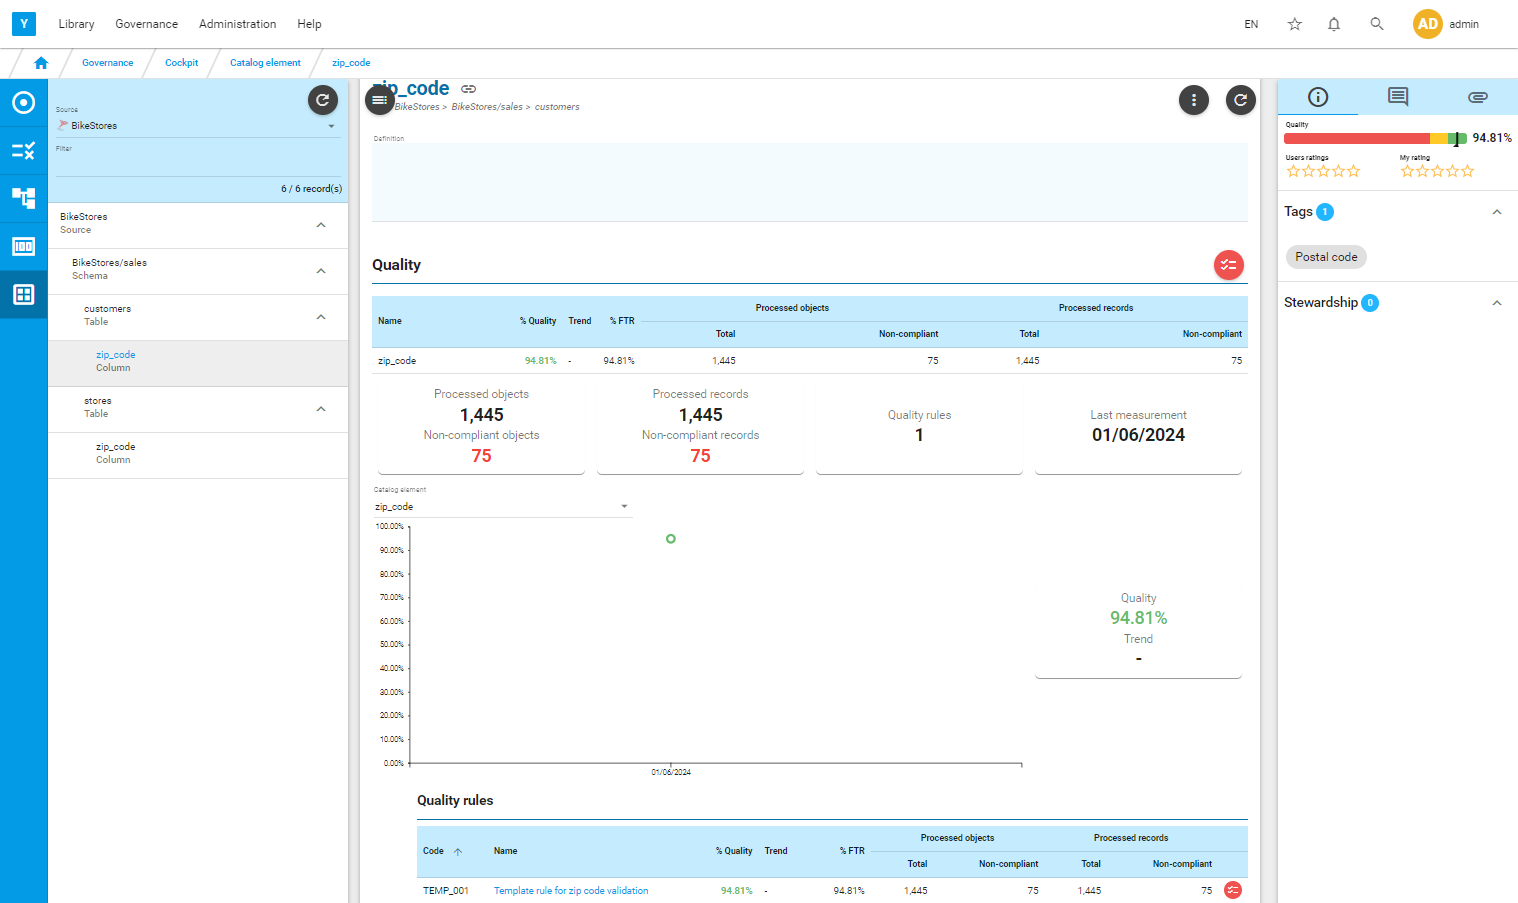
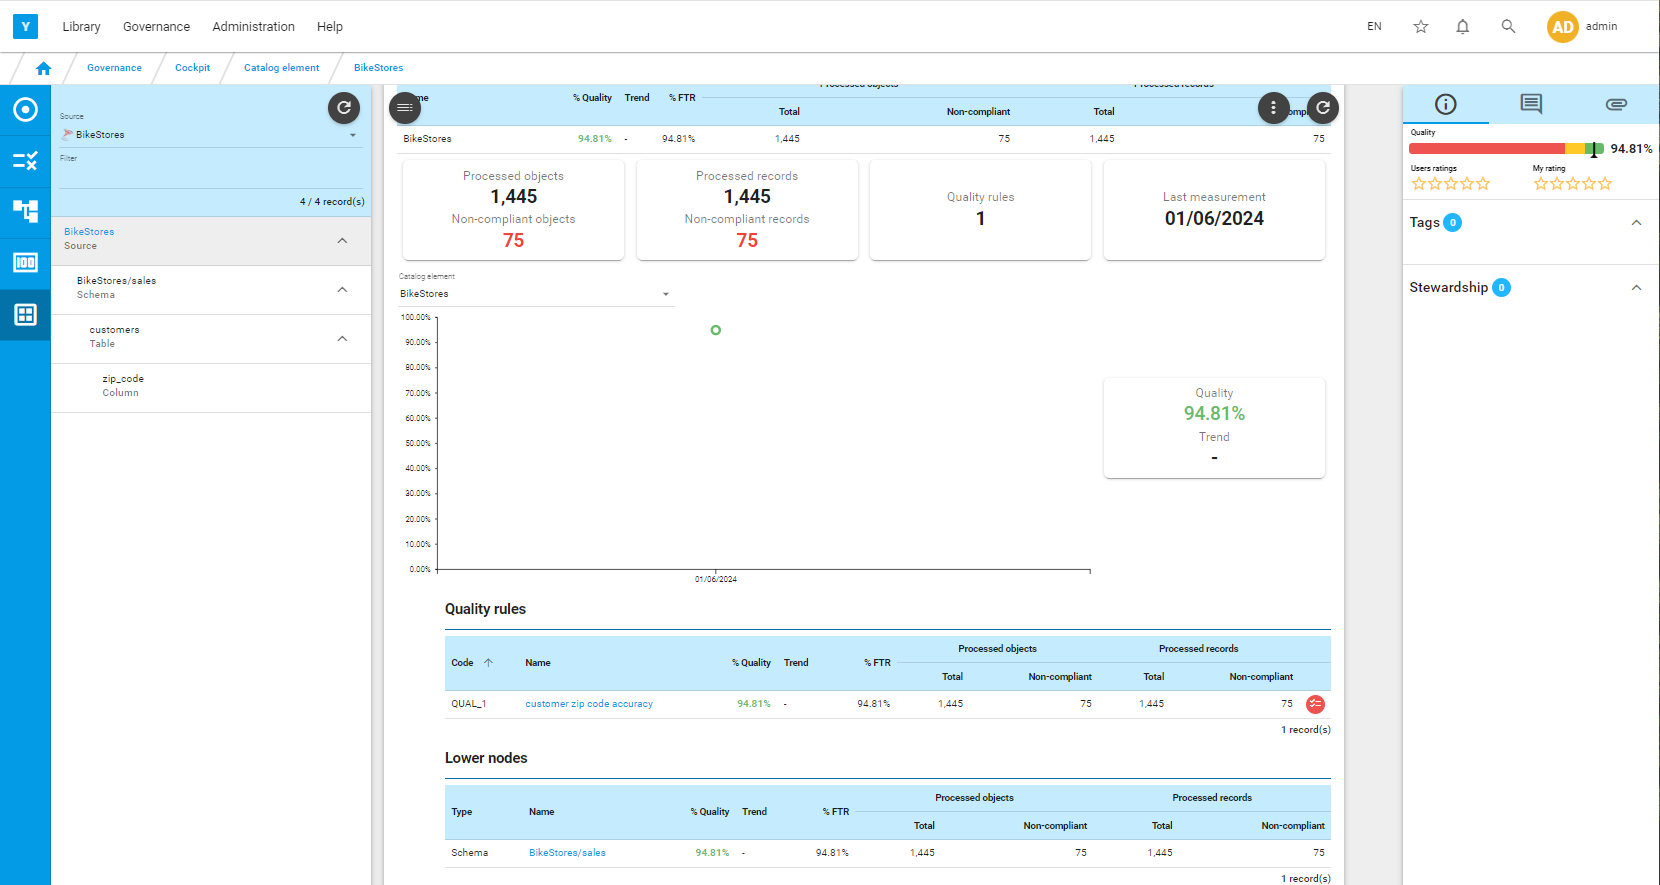
Then go to the cockpit to the see the quality level of the source.
You can navigate from the source level to the column level on the left.
Rule template
If you have the similar columns in different sources, instead of creating and assigning a different rule to each column, you can create a template rule and assign it to both columns.
Example in BikeStores, there is a column zip_code in table customers and a column zip_code in table stores.
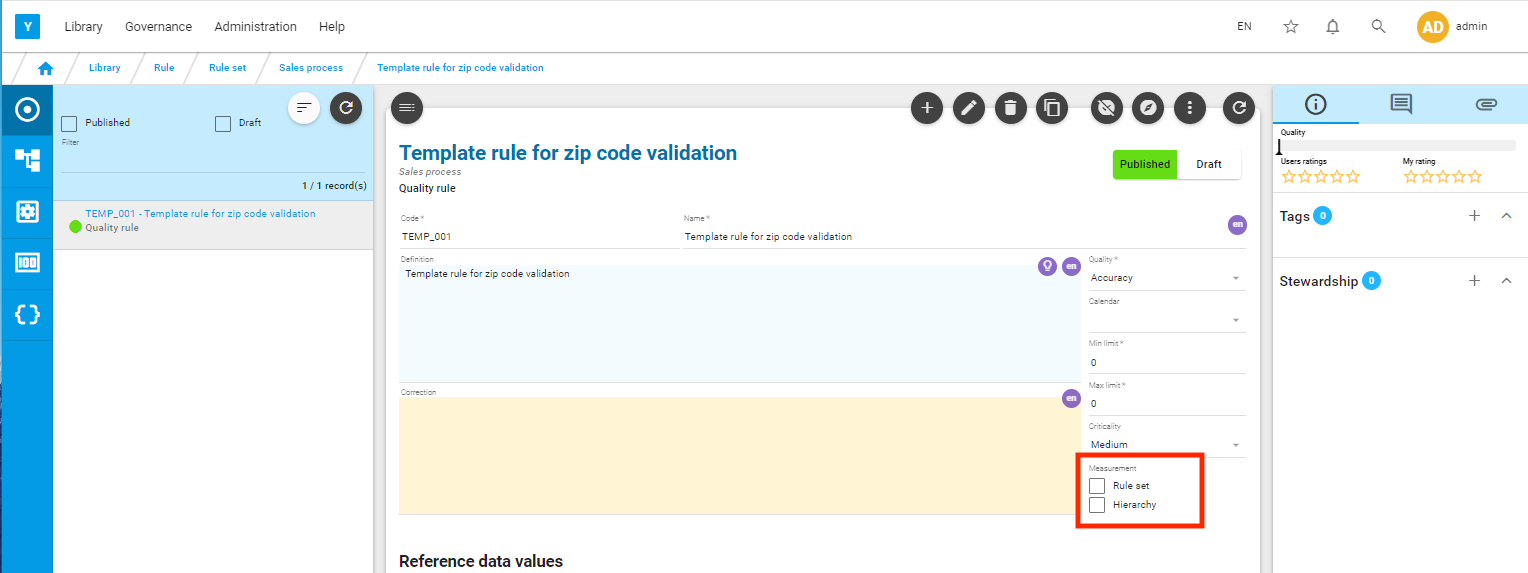
Create a template rule under the rule set ‘Sales Process’.
Reminder : with Yavantha-CE, you can only create 10 rules.
You have to deselect the measurement flags for a template rule.
Go to Menu: Library/Rule/Script
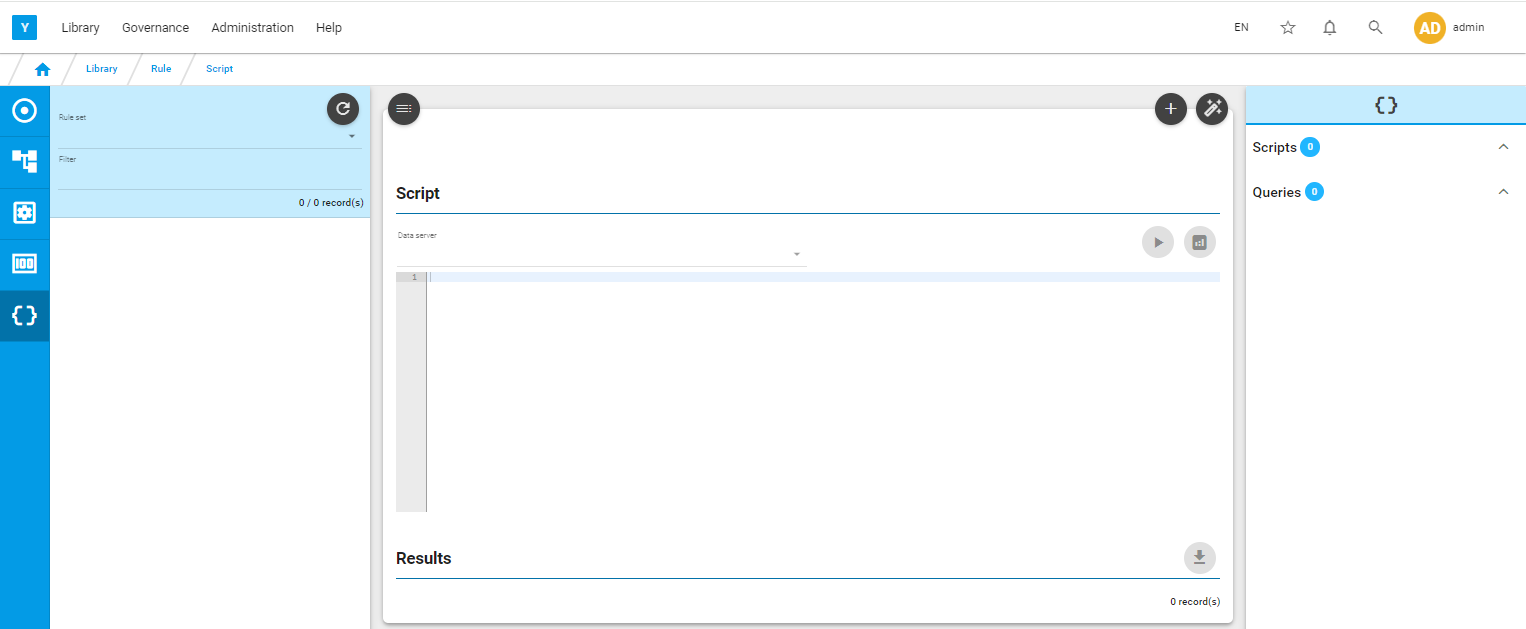
Click on ![]() to create a new script.
to create a new script.
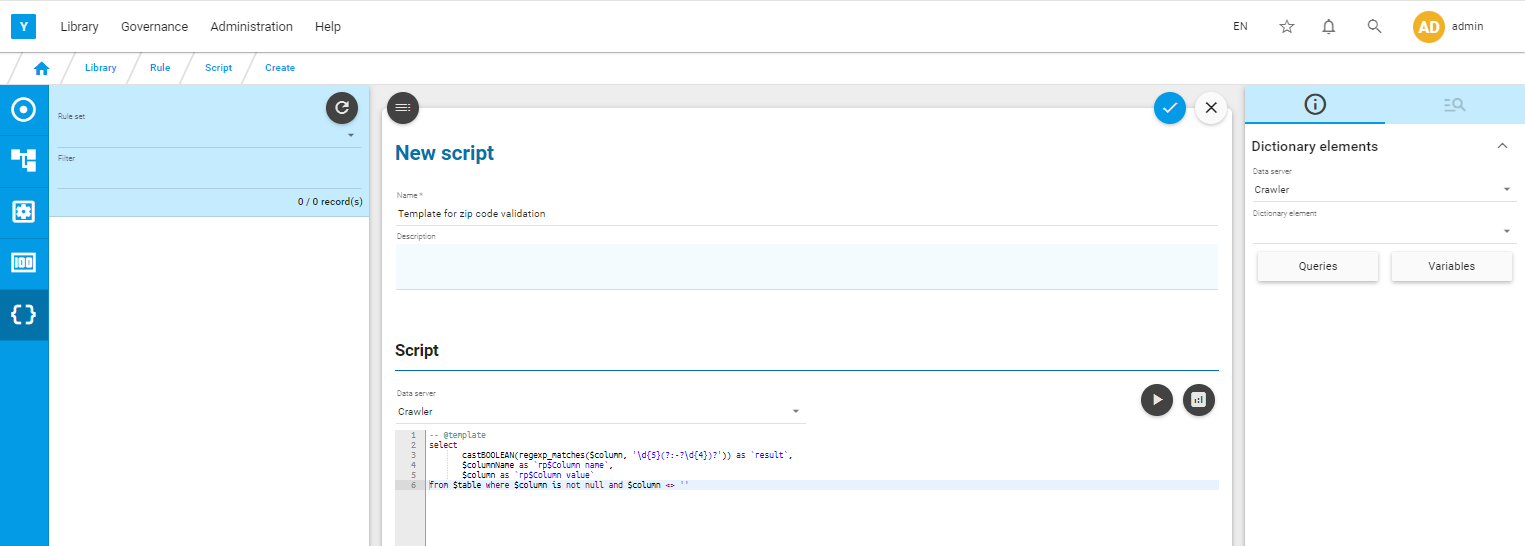
The first line of a template script must be : -- @template
Click on ![]() to save the script
to save the script
Go back to the rule.
It should be in draft status. Click on ![]() to enter edit mode.
to enter edit mode.
From the Script section, click on ![]() and associate the script
and associate the script
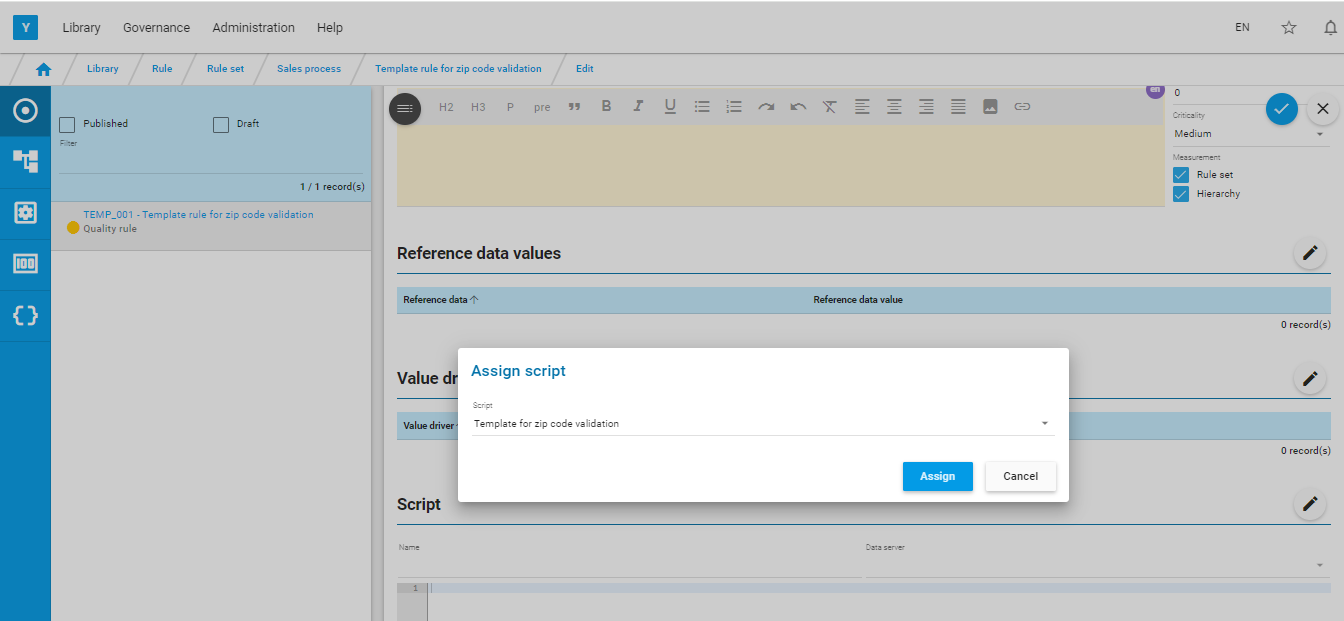
Save the rule via ![]() and publish it via
and publish it via ![]() .
.
Now you can associate the rule to the two zip_code columns.
You can now measure the quality of the data source
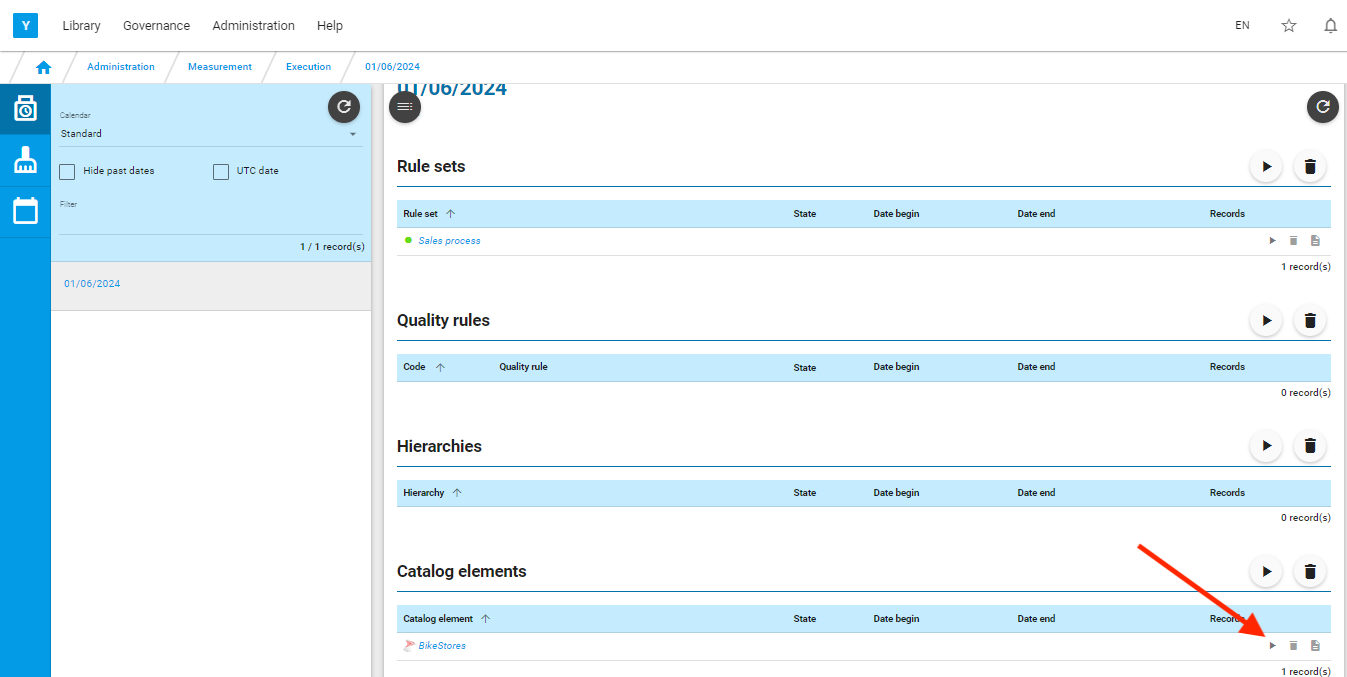
Go to menu: Administration/Measurement/Execution
Select the earliest future calendar date displayed on the left, select the data source, and click on ![]() .
.
Click on the Source name to be directed to the corresponding cockpit or go to Menu: Governance/Cockpit (Catalog)
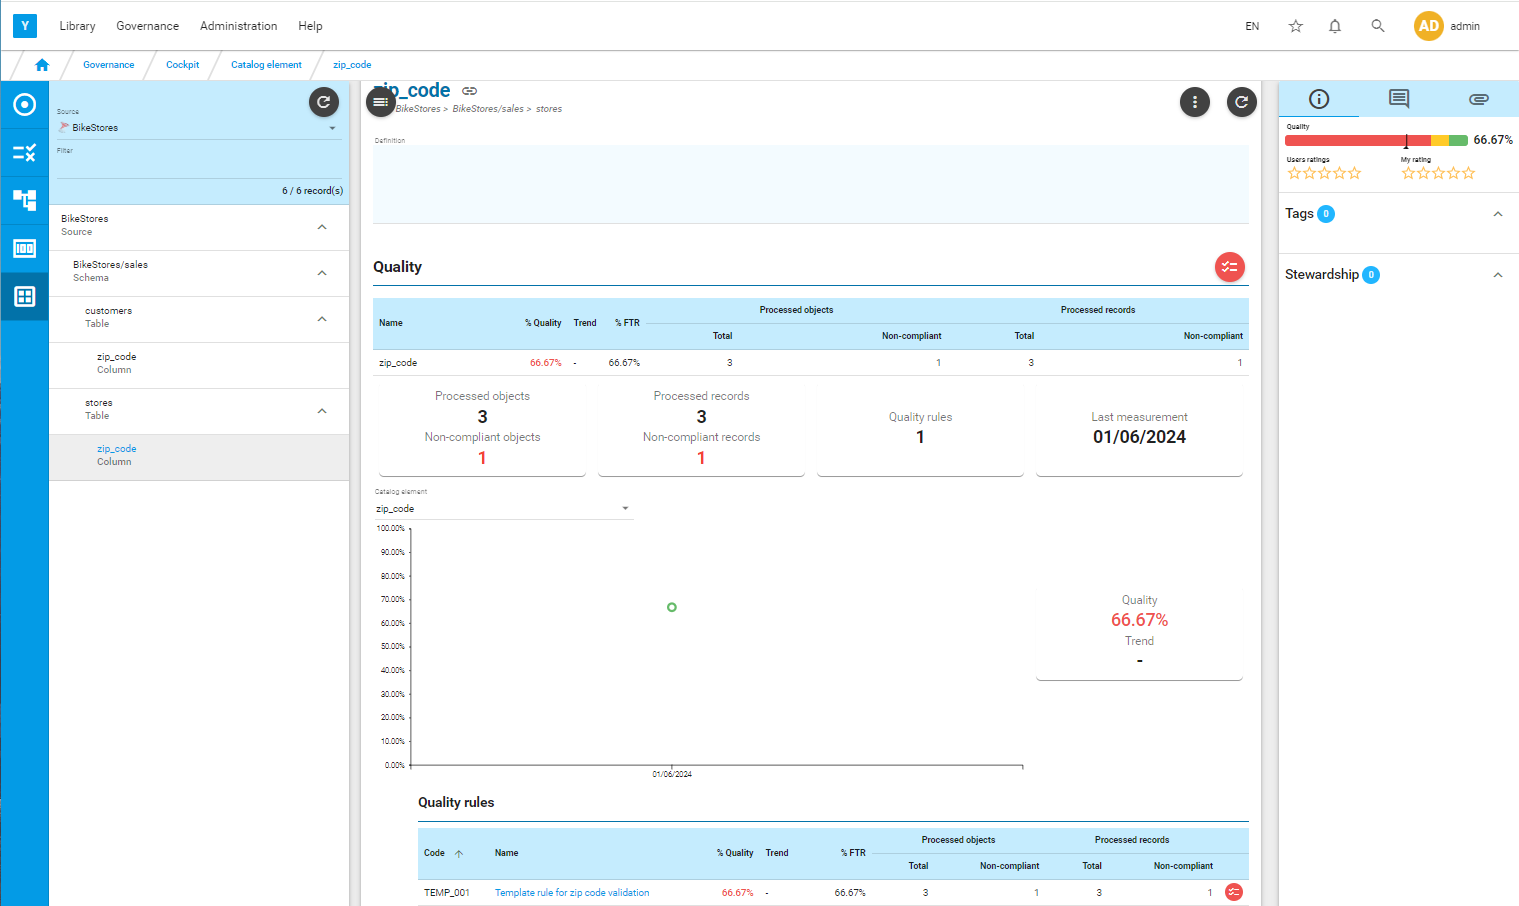
You can see the quality measured for the two zip_code columns , for the tables, for the schemas and for the source.